Sprint List
The
TEAM ROOM
Sprint List
![]() contains a list of the Stories contained in the selected Sprint. You can expand them to see the Tasks. You can also double
click for in-line editing.
contains a list of the Stories contained in the selected Sprint. You can expand them to see the Tasks. You can also double
click for in-line editing.
Information Pane
- Sprint List
- Select a Sprint from the list.
- Remaining Days
- Shows how many days remaining in the Sprint.
- Remaining Hours
- Shows how many hours of actual hours work left compared with planned.
- Accepted
- Provides the percentage of the number of accepted stories that are accepted.
- Operating Capacity
- Point-based metric comparing how many points are being completed compared to planned.
- Edit Sprint
- Click to Edit Sprint.
 Code Review
- Click to view the Code Review Summary window which provides metrics on code reviews in the Sprint. For more information, see Code Review.
 Sprint Activity
- Click to view the Sprint Activity window which provides a date-based listing of all changes to your Stories.
 Discussions
-
In addition to each Story supporting Discussions, each Sprint supports Discussions. Click the Discussion icon
 to open the
Sprint Discussions box. For more information, see
Discussions.
to open the
Sprint Discussions box. For more information, see
Discussions.
Team Overview
The
Team Overview pane provides graphs and charts and informative data about your sprint. The pane can be expanded or collapsed using the arrow
to the right
 .
.
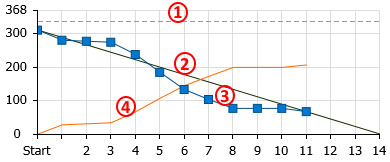
- Burndown
- The
Burndown chart is a run-chart of outstanding work that shows the total number of hours on the vertical access with number of days
on the horizontal access. This chart is used to help predict when the work will finish.
- The horizontal dashed line at the top represents the team capacity.
- The solid line represents the ideal Burndown rate.
- The blue line with boxes represents the actual hours remaining and should be trending down.
- The solid orange line (Burnup) indicates the time recorded by the team and should be trending up, ideally an inverse of the boxed line.
 Tip: When a Quick Filter is selected, all the lines represent the currently applied quick Filter. For example, you can select a team member and see their individual Burndown. For more information, see Managing User Capacity.
 - Cumulative Flow
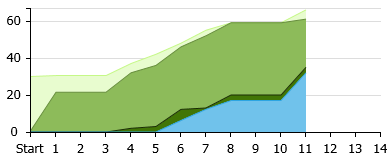
-
The TEAM ROOM Cumulative Flow chart represents the amount of work in the Sprint in different states for each day of the Sprint. The vertical axis represents the points in the Sprint. The horizontal axis represents each day of the sprint. It includes Points Not Started (light green), Points In Progress (green), Points Completed (dark green), and Points Accepted (blue). The height of the chart defines the scope. If something is added or the estimate is increased, then the whole chart gets taller. If something is removed or the estimate decreased, then the chart gets smaller. It provides the ability to see changes in scope in the sprint.
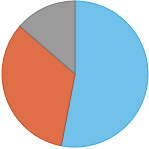
- Points by Type
- The
Points by Type graph provides a pie chart of the distribution of percentage of work based on the types of Stories. Click one of the types
to apply a Quick Filter to see just those items.
- Health & Progress
- The information in this list contains data points of the Sprint of which you need to be aware. There are positive indicators
(
 ) and trouble indicators (
 ):
):
- Number of blocked Stories.
- Stories not estimated.
- Stories without Tasks.
- Tasks not estimated.
- Tasks with actual hours greater than estimated hours.
Click any of the items in the list with a
to apply a filter to only show those items.
When a filter is applied, you can click the clear icon ( ) to clear any filter.