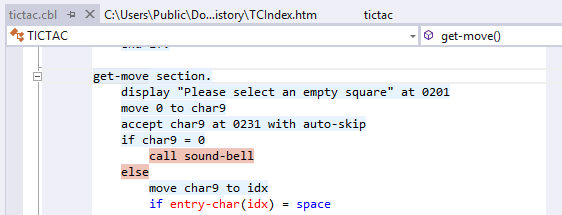


Running the application with code coverage produces a Results.tcz file in the folder specified in Tools > Options > Micro Focus > Code Coverage > Results Options. Enterprise Developer uses the information in this file to provide statistics in the Micro Focus Code Coverage window about what percentage of the code has been executed as well as color indication of the code in the editor for covered (executed) and missed (not executed) blocks as well as covered and unexecuted programs.
Enterprise Developer preserves the history of running the application with code coverage by creating a Results_datetime.tcz file in a History subfolder in the location of the Results.tcz file.
From the Micro Focus Code Coverage window, you can navigate to the covered and missed blocks of code in the editor, export the code coverage information as a .tcz file, import existing coverage results files or merge the .tcz files produced from different runs of the application. You can also generate the code coverage index report file, TCIndex.htm, in HTML format.
After executing an application with code coverage, the IDE automatically opens the Micro Focus Code Coverage window to display the code coverage information. If the window is not visible, to display it click View > Micro Focus Code Coverage.
The window visualizes the code coverage information from the latest run with code coverage stored as a Results_datetime.tcz file. It shows the paragraphs and the sections within the program and what percentage of the code has been covered or not:

To view the covered and missed blocks, either scroll down the code of a COBOL program or double-click the lines of the program's structure in the Micro Focus Code Coverage window:

You can specify your color preferences for the colorization of covered and missed blocks as follows:
The information displayed in the Micro Focus Code Coverage window and the colorization of the editor reflect the state of the application at the time it was executed to produce that specific coverage results file. If you then make a change in the code and compile it, this might move the code in the editor. As a result, the colorization in the editor might not accurately match the information displayed in the Micro Focus Code Coverage window. The data displayed in the Micro Focus Code Coverage window will still reflect the historical state of the program when the data was generated.
Other situations where the colorization in the editor might not accurately represent the information in the code coverage view include:
Enterprise Developer keeps the history of the previous results of running the application with code coverage. To load the results from previous runs with code coverage, click
 immediately next to the field showing the current results file and select an item from the list.
To export the code coverage information and save it as a .tcz results file:
To import the code coverage information from an existing .tcz results file:
 (Import coverage), in the
Micro Focus Code Coverage window.
This imports the code coverage statistics from the .tcz file into the Micro Focus Code Coverage window and adds colorization to your source files indicating the missed and the covered blocks.
You can merge the results file from different executions with code coverage. This provides combined statistics of running the application in different scenarios. To merge the results:
To toggle the code coverage colorization on or off in the editor, click
 (Show code coverage coloring) in the
Micro Focus Code Coverage window.
To show the unexecuted programs, click
 (Show unexecuted program information) in the
Micro Focus Code Coverage window.


