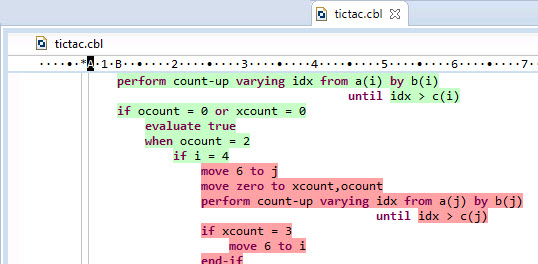


Running an application with code coverage produces a .tcz report file. Visual COBOL uses the information in this file to provide statistics in the Code Coverage view about what percentage of the code has been executed as well as to colorize the code in the editor to indicate covered (executed) and missed (not executed) blocks as well as covered and unexecuted programs.
From the Code Coverage view, you can navigate to the covered and missed blocks of code in the editor, import code coverage data from existing .tcz files or merge the report files produced from different runs of the application, and relaunch the application in code coverage mode.
After executing an application with code coverage, the IDE automatically opens the Code Coverage view to display the code coverage information. (If the view is not visible, to display it click Window > Show View (or Show View > Other), expand Micro Focus, click Code Coverage, then click OK).
The view visualizes the code coverage information from the filename.tcz results file produced during the latest run with code coverage. The view shows the sections and the paragraphs in a program and what percentage of the code has been executed (covered) or not (not covered):

To view the covered and missed blocks, either scroll down the code of a COBOL program or double-click the lines of the program's structure in the Code Coverage view:

You can specify your color preferences for the colorization of covered and missed blocks as follows:
The information displayed in the Code Coverage view and the colorization of the editor reflect the state of the application at the time it was executed to produce that specific coverage results file. If you then make a change in the code and compile it, this might move the code in the editor. As a result, the colorization in the editor might not accurately match the information displayed in the Code Coverage view. The data displayed in the Code Coverage View will still reflect the historical state of the program when the data was generated.
Other situations where the colorization in the editor might not accurately represent the information in the code coverage view include:
To import the code coverage information from an existing .tcz results file:
 (Import Session).
This imports the code coverage statistics from the .tcz file into the Code Coverage view and adds colorization to your source files indicating the missed and the covered blocks.
Situations in which this behavior might occur are:
After making changes to your application, to rerun the application with code coverage results:
To delete the coverage results currently displayed in the Code Coverage view:
To delete all code coverage results:
You can merge the results file from different executions with code coverage. This provides combined statistics of running the application in different scenarios. To merge the results:
 (Merge History Items).
This creates a new results file that includes the combined statistics and opens it in the Code Coverage view.
Visual COBOL preserves the history of the previous results of running the application with code coverage.
Click
 (Manage History) to view and load the statistics from previous runs with code coverage, to remove previous results, or to configure how many items are preserved in the history.


