

This tutorial introduces the Visual Studio Integrated Development Environment, shows how to create and build a native COBOL console application, and demonstrates some of the features you can use when debugging native code.
To run this tutorial, you must have both Microsoft Visual Studio and Visual COBOL installed.
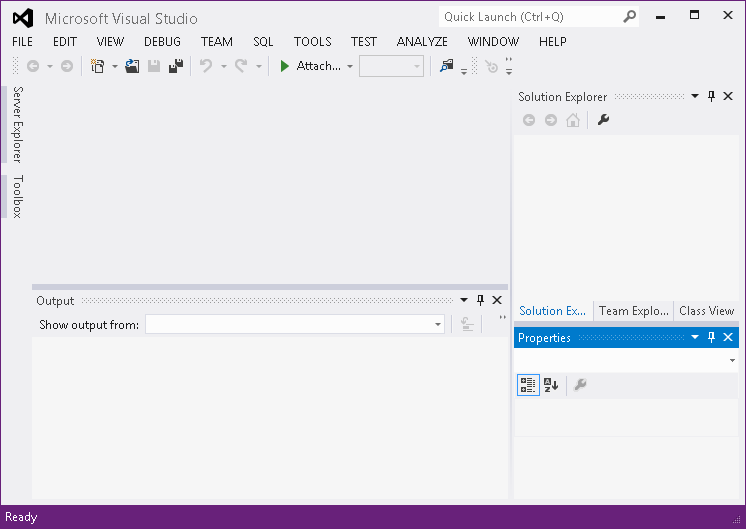
The IDE is shown in the figure below, although the information displayed in the large pane will be different.

The large pane is where your solutions and projects will be opened. At the moment, this shows the Start Page, with up-to-date information on Visual Studio. When you start work, this pane is where your code is displayed.
The pane at the bottom is the Output window, where messages from the IDE and Compiler are displayed.
The right pane is the Solution Explorer, which displays the structure of your solution and projects. At the bottom of the Solution Explorer pane are some tabs. Solution Explorer appears by default.
If any of these panes is hidden, you can show it from the View menu.
The first task is to create a solution and a project. A solution is a container holding one or more projects that work together to create an application. The solution has the extension .sln, and is a readable text file. Microsoft recommends you do not edit the file outside of Visual Studio.
A COBOL project has the extension .cblproj, and again this is a readable file, but Microsoft recommends that you do not edit it. Different types of project have different extensions, so for example a C# project has the extension .csproj.
In this section, you create a project and solution, as follows:
Notice that the Name and Solution name fields have the same name.
For example, if you create a folder on your c: drive called tutorials, change the location field to c:\tutorials. The solution will be stored in a subdirectory NativeApplication, according to the project name.
This creates a solution and a project. The Solution Explorer shows the NativeApplication project. It contains:
For the purposes of this demonstration you will use a sample program that sets a pointer to the memory address of a variable.
       program-id. Program1.

       working-storage section.
       01 fred     pic x(100) value "start".
       01 fred-pointer pointer.

       procedure division.
           set fred-pointer to address of fred
           display "hello"
           move "testdata" to fred
           display "hello again"
           if fred = "middle"
               move "end" to fred
           end-if
           move "Richard Nixon" to fred
           display "fred contains " fred
           goback.

       end program Program1.
There are two default build configurations for each project type: Debug and Release. These configurations define how to build the project for the different situations.
To build the project for debugging and to run it:
Notice in the Standard toolbar at the top of the IDE, that Debug shows as the active configuration.
The Build option builds only those files that have changed since they were last built, whereas the Rebuild option builds all the files in the project, regardless of whether they have changed since they were last built.
 .
.
A console window opens, showing the output from the execution of the sample application.
Project properties define characteristics of the project and enable you to control a project's behavior among other things. Different properties are set by default for different types of projects.
If the Properties window is not visible, you can show it by clicking View (> Other Windows) > Properties Window.
A description of the selected property is displayed dynamically at the bottom of the Properties window. To turn this description on and off, right-click in the description.
The IDE provides debugging facilities, such as stepping, examining data item values and setting breakpoints. To see some of these facilities:
Alternatively, you can click
 , or press
F5.
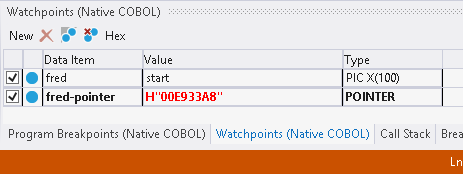
Visual Studio enters debug mode and stops on the line for display "hello". This is because you set watchpoints for the two variables in the program and the value of one of them, fred-pointer, has changed. The debugger breaks the execution and stops on the first line after the one on which the value of the data item changed.
Notice that the Watchpoints window indicates the change by emboldening the data item and highlighting the changed value in red:
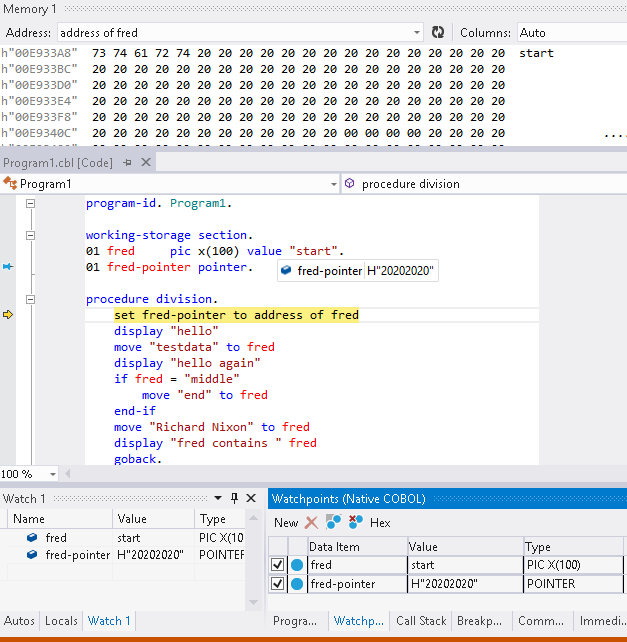
A console opens for running the built program. In the IDE, the first statement in the PROCEDURE DIVISION of the source code is highlighted and the cursor is positioned on it. This is the statement that will be executed next. The statement sets the pointer fred-pointer to the memory of address of the variable fred.
The IDE enables you to watch the memory and how the values of variables change during the execution of the program. The next steps describe how to enable the Memory and Watch windows, and add watches to the two variables.

This sets the pointer fred-pointer to the memory address of fred. The value of fred-pointer changes and you can see the new one in the DataTip and in the Watch window. The new value is the HEX address of fred.


After you have finished debugging, you can close Visual Studio. You do not need to explicitly save anything, because the files are automatically saved when you build them.


