3.5 How to access the cluster dashboard?
The cluster dashboard provides a graphical representation of a cluster. To view details:
-
Browse and select the cluster objects you want to view.
-
Select a cluster, then select Dashboard.
-
The cluster dashboard offers two views:
-
Dashboard view
 : Displays the Dashboard, Nodes and Resources.
-
Table view
 : Displays a comprehensive view of Nodes and Resources, which is useful when dealing with a long list of nodes and resources.
-
The cluster dashboard displays the following information:
3.5.1 General
-
Cluster Information: Displays the IP address bound to the master node and remains associated with the master node, regardless of any server changes. The default cluster port number is 7023.
-
Quorum Triggers: Displays the number of nodes required in the quorum and the time the cluster should wait before ignoring the quorum.
-
Notifications: Email message are sent for specific cluster events, such as changes in cluster and resource state or nodes joining or leaving the cluster.
3.5.2 Priorities
Displays the load priorities of individual cluster resources on a node during the cluster startup, failover, or failback. Resource priority determines the order in which resources load.
3.5.3 Protocols
Displays details on transmit frequency and tolerance settings for all nodes in the cluster, including the master node. The master node is typically the first node brought online, but in case of failure, any other node can become the master. For more information, see the Configuring Cluster Protocols in the OES Cluster Services for Linux Administration Guide.
3.5.4 RME groups
Displays a combination of resources available to the cluster. Resources within the same group cannot run concurrently on a node, and a resource can belong to multiple groups. There are four fixed RME groups (Group A, Group B, Group C, and Group D), and their names cannot be customized.
3.5.5 BCC
Displays list of Business Continuity Clustering (BCC) enabled clusters with the administrator details and location of the cluster. This option will be available for the clusters only if the OES environment has BCC installed and configured. For more information, see Installing Business Continuity Clustering in the BCC Administration Guide.
3.5.6 Graphical Representation
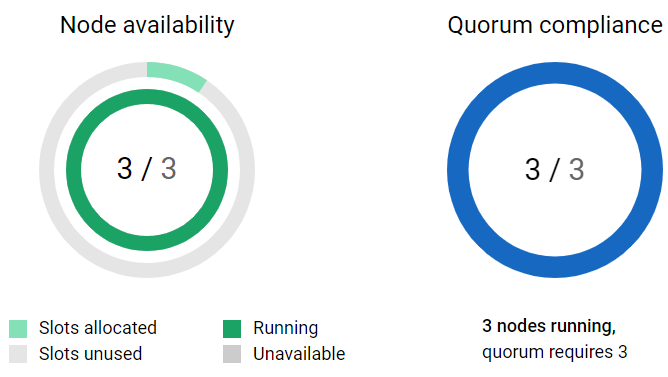
On the right side of the dashboard there is a graphical representation of the cluster nodes.
-
Node availability: The outer graph indicates the number of nodes in use out of a total of 32, while the inner graph displays the available nodes and unhealthy nodes.
-
Quorum compliance: Displays the number of nodes required for the quorum to be met and number of nodes running.
