5.4 Understanding the Layout of OES Remote Manager
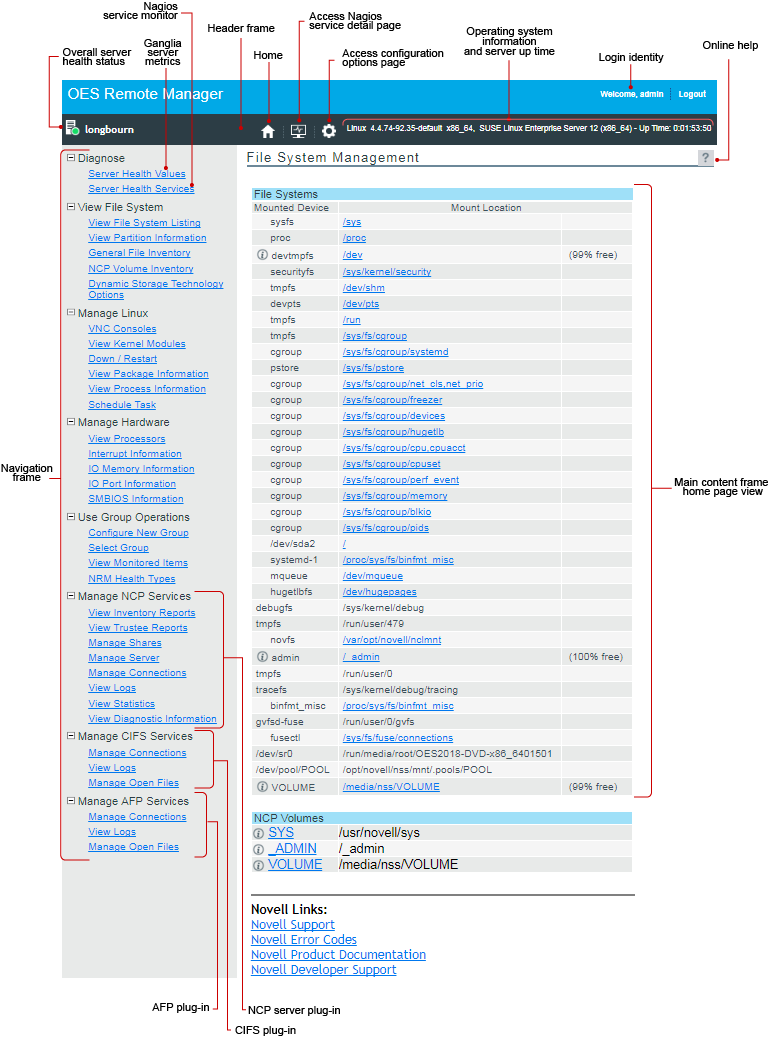
The web pages for OES Remote Manager have three main frames: the header frame (top), the navigation frame (left), and the main content frame (right). They also contain the Overall Health Indicator and online help.
Figure 5-1 shows the overall layout of OES Remote Manager.
Figure 5-1 Layout of OES Remote Manager

See the following sections for more information about the layout of the OES Remote Manager Home page:
5.4.1 Header Frame
The header frame contains the toolbar and general information about the server.
The toolbar buttons link to the following functions:
-
 Home
HomeThe File System Management page is considered the Home page.
-
 Health Monitor (Nagios Service Detail in OES 11 SP2 and later)
For information about configuring and using Nagios to monitor services, see Section 7.2, Configuring Nagios.
-
 Configuration
For information about OES Remote Manager Configuration Options, see Section 6.0, Changing the HTTPSTKD Configuration.
The general information about the server includes the following:
-
Name of the user you logged in as to OES Remote Manager (typically, the root user)
-
Server hostname
-
Version of the Linux kernel running on the server
-
Hardware platform
-
Operating system running on the server
-
Up time for the server (the amount of time the server has been running since the last reboot) in the format of days:hh:mm:ss.
5.4.2 Overall Health Indicator
The Overall Health Indicator shows the current server health status as good, suspect, bad, or no connection. For OES, the status is determined from the services that you configure to be monitored by Nagios. The indicator changes if any Nagios-monitored service has a problem alert. If there are multiple alerts, the indicator represents the worst reported health condition. You can click the Server Health icon (shown in Table 5-2) to go to the Nagios Service Detail page and view the health statistics and alerts for the monitored services. By default, only basic services are set up to be monitored by Nagios. In order for the Overall Health Indicator to consider the health of additional services, you must configure them to be monitored by Nagios. For information about configuring and using Nagios, see Section 7.2, Configuring Nagios.
Table 5-2 Overall Server Health Status Conditions
|
Overall Health Status |
Server Health Icon |
Icon Description |
|---|---|---|
|
Good |

|
Green orb in a white circle |
|
Suspect |

|
Yellow orb in a white circle |
|
Bad |

|
Red orb in a white circle |
|
No connection to the server |

|
Black X in a white circle |
5.4.3 Navigation Frame
The navigation frame lists general tasks that you can perform, and provides links to specific pages for performing those tasks. The left navigation frame includes collapsible categories that are remembered the next time you log in. This lets you display the OES Remote Manager features that you use most often and hide some of the ones that you don’t.
IMPORTANT:When you work in OES Remote Manager, you must use the navigation links provided in the tool. Using the browser's Back button can result in unintended actions being re-sent to the server.
Basic links in the navigation frame are identified in Table 5-3.
Table 5-3 Standard Roles in the Navigation Frame
|
Roles |
Description |
For more information, see |
|---|---|---|
|
Diagnose |
Monitor the health of the server and services. |
|
|
View File System |
Browse the file system, view information about files, folders, and partitions, and generate inventories. |
|
|
Manage Linux |
View information about kernel modules, packages, and processes. Schedule CRON jobs. |
|
|
Manage Hardware |
View information about processors, interrupts, memory, ports, and SMBIOS. |
|
|
Use Group Operations |
Configure groups of servers to be monitored collectively. |
5.4.4 Program Plug-Ins in the Navigation Frame
The links in the navigation frame change depending on the programs installed on the server that have plug-ins to OES Remote Manager. The plug-ins are installed automatically when you install the related OES Services.
Table 5-4 Program Plug-In Roles in the Navigation Frame
|
OES Service |
Roles in the Navigation Frame |
For more information, see |
|---|---|---|
|
NCP Server and Dynamic Storage Technology |
Manage NCP Services allows you to manage NSS volumes, NCP volumes, DST volumes, NCP volume inventories, and NCP connections on the server. |
|
|
Dynamic Storage Technology Options allows you to configure and manage Dynamic Storage Technology volumes and policies. The DST functions are integrated with Manage NCP Services. |
||
|
Novell CIFS |
Manage CIFS Services allows you to manage OES CIFS connections on the server. |
5.4.5 Main Content Frame
The information in the main content frame changes depending on which link you click in the header or navigation frame. The File System Management page is considered the Home page.
5.4.6 Online Help
When a Help icon  appears in the upper-right corner of a page in the main content frame, you can view help for the page that is displayed.