Viewing the code coverage information
Running the application with code coverage produces a Results.tcz file in the folder specified in Tools > Options > Micro Focus Tools > Code Coverage > Results Options. Visual COBOL uses the information in this file to provide statistics in the Micro Focus Code Coverage window about what percentage of the code has been executed as well as color indication of the code in the editor for covered (executed) and missed (not executed) blocks as well as covered and unexecuted programs.
Visual COBOL preserves the history of running the application with code coverage by creating a Results_datetime.tcz file in a History subfolder in the location of the Results.tcz file.
From the Micro Focus Code Coverage window, you can navigate to the covered and missed blocks of code in the editor, export the code coverage information as a .tcz file, import existing coverage results files or merge the .tcz files produced from different runs of the application. You can also generate the code coverage index report file, TCIndex.htm, in HTML format.
Code coverage statistics
After executing an application with code coverage, the IDE automatically opens the Micro Focus Code Coverage window to display the code coverage information. If the window is not visible, to display it click View > Micro Focus Code Coverage.
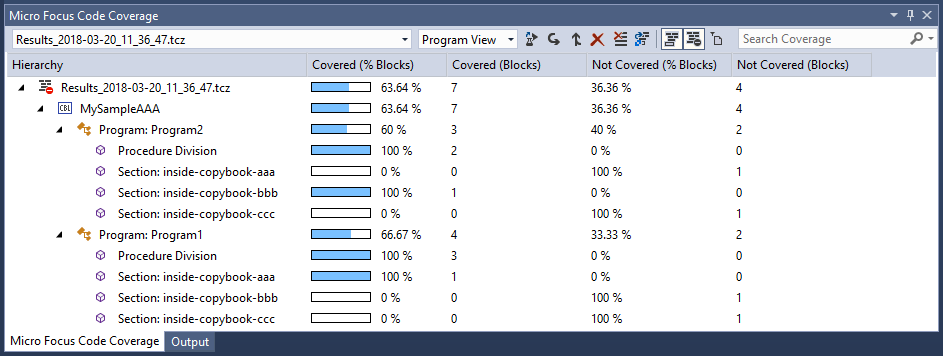
The window visualizes the code coverage information from the latest run with code coverage stored as a Results_datetime.tcz file. The code coverage information can be displayed in two different views:
- Program View
- File View
By default, the program view is displayed. It displays the paragraphs and the sections within the program and what percentage of the code has been covered in the context of blocks in programs and whether they are from a copybook:

To change to the file view, click
 (Switch coverage view) and choose
File View. This view displays a list of files, programs or copybooks, and what percentage of code has been covered in the context of
statements:

Covered and missed blocks
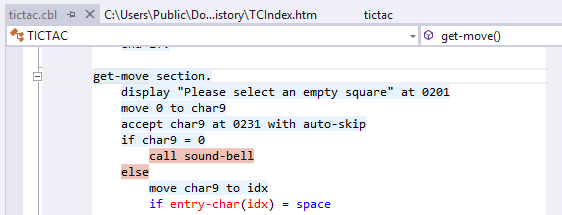
To view the covered and missed blocks, either scroll down the code of a COBOL program or double-click the lines of the program's structure in the Micro Focus Code Coverage window:

By default, covered code is blue and code that is not coved is red. You can specify your color preferences for the colorization of covered and missed blocks as follows:
- In the IDE, click Tools > Options > Environment > Fonts and Colors.
- Specify your preferences for the following items in the Display items list - COBOL Code Coverage - Covered and COBOL Code Coverage - Not Covered.
- Click OK.
Editing the code after producing coverage results
The information displayed in the Micro Focus Code Coverage window and the colorization of the editor reflect the state of the application at the time it was executed to produce that specific coverage results file. If you then make a change in the code and compile it, this might move the code in the editor. As a result, the colorization in the editor might not accurately match the information displayed in the Micro Focus Code Coverage window. The data displayed in the Micro Focus Code Coverage window will still reflect the historical state of the program when the data was generated.
Other situations where the colorization in the editor might not accurately represent the information in the code coverage view include:
- The results from running with code coverage are accumulated in a single results file (specified in Tools > Options > Micro Focus Tools > Code Coverage > Results Options).
- When loading a merged results file that includes the data from different runs with code coverage.
- When loading a results file from running the application with code coverage before you changed the code.
Viewing previous code coverage results
Visual COBOL keeps the history of the previous results of running the application with code coverage. To load the results from previous
runs with code coverage, click
 immediately next to the field showing the current results file and select an item from the list.
Exporting code coverage information
To export the code coverage information and save it as a .tcz results file:
- Click
 , (Export the currently loaded coverage data), in the
Micro Focus Code Coverage window.
- Specify a name and location for the coverage file, then click Save.
Importing existing code coverage results
To import the code coverage information from an existing .tcz results file:
- Click
 (Import coverage data), in the
Micro Focus Code Coverage window.
- Browse to and select an existing code coverage report
.tcz file, then click
OK.
This imports the code coverage statistics from the .tcz file into the Micro Focus Code Coverage window and adds colorization to your source files indicating the missed and the covered blocks.
Merging the code coverage results from different runs
You can merge the results file from different executions with code coverage. This provides combined statistics of running the application in different scenarios. To merge the results:
- Click
 , (Merge Coverage), in the
Micro Focus Code Coverage window.
- In the
Merge Results dialog box, check the results files you want to merge, then click
OK.
This creates a MergedCoverageFile_datetime.tcz results file and loads the information in it in the Micro Focus Code Coverage window.
Toggling the code coverage colorization on or off
To toggle the code coverage colorization on or off in the editor, click
 (Toggles editor coverage highlighting) in the
Micro Focus Code Coverage window. When this is toggled on, an adornment is displayed at the top-right of the active editor, providing information on
the current view being used.
Showing unexecuted programs
To show the unexecuted programs, click
 (Include data involving non-executed programs) in the
Micro Focus Code Coverage window.
Generating an HTML report
To view the code coverage index report file,
TCIndex.htm, click
 (Generate HTML Report) in the
Micro Focus Code Coverage window.
Deleting code coverage results
To delete the
Results_datetime.tcz that is currently loaded in the
Micro Focus Code Coverage window, click
 (Clear Active Coverage). This unloads the file from the IDE and deletes it from disk. To delete all results files, click
 (Clear History).
Filtering files with no statements
When in the file view, you can filter out files from the displayed list that do not contain statements that are covered. To
filter files, click
 (Filter files with no statements) in the
Micro Focus Code Coverage window.
Filtering views by search strings
To filter the rows displayed in either view, type a string in the search filter field in the Micro Focus Code Coverage window.