Chart Window
Chart Window UI
The Cross-Platform Client enables you to generate charts from items in the upper pane.
- Toolbar
- After generating a chart the
Chart window opens displaying the chart of the items specified. The
Chart window toolbar enables you to :
- Save charts as .jpg files.
- Select a different chart type, such as an area chart or bar chart.
- Edit chart colors.
- View charts in 2–D or 3–D.
- Optionally show chart legends or horizontal or vertical grid lines.
- Edit chart titles.
- Optionally show chart data in a table format.
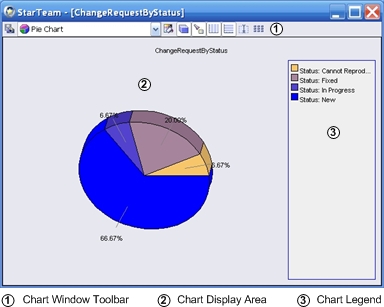
- Display Area
- The chart display area presents your chart data. You can select a different chart type using the drop-down list provided in the chart window toolbar.
- Legend
- The chart legend displays by default. You can optionally display the chart legend (toggle on or off) using the Toggle legend toolbar button in the chart window toolbar.