Citrix TrueLogs
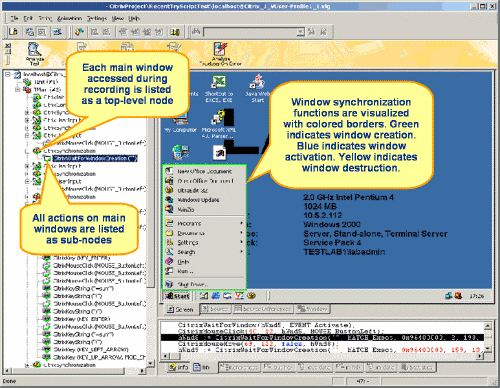
TrueLog Explorer may optionally be opened along with the Citrix player during Try Script runs (by selecting the Animated Run with TrueLog Explorer check box on the Try Script dialog box). TrueLog Explorer displays the data that is actually downloaded during Try Script runs. Each main window accessed during recording is listed as a top-level API node in the TrueLog Explorer menu tree. Actions recorded against those windows are listed as subnodes.
By selecting a high-level synchronization node you see a window as it appeared after the last synchronization function (the bitmap captured during replay).
Window synchronization functions are visualized with colored borders. Window creations are indicated with green borders. Window activations are indicated with blue borders. Window destructions are indicated with yellow borders.
TrueLogs work in complement with the Citrix player by visualizing screen states. For example, if you are not sure which window is indicated by a certain window ID that is listed in the Citrix Player Log window, you can find the corresponding synchronization function in the corresponding TrueLog and thereby access a bitmap that shows the window in question.

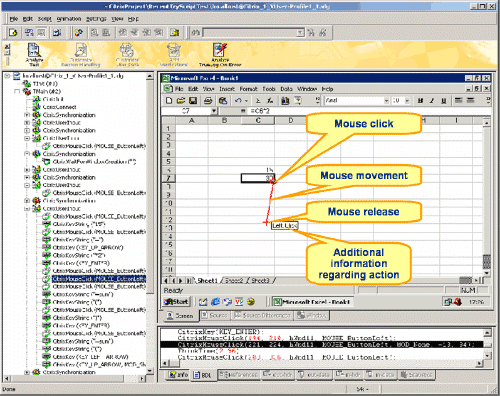
User input nodes (CitrixUserInput and related functions) reflect keyboard and mouse input. CitrixMouseClick functions offer two track vector parameters (X and Y coordinates). Red squares indicate mouse-click start points. Red cross-marks indicate mouse release points. A red line between a start and end point indicates the path of the mouse. If there is no move while the button is pressed then only a red cross is displayed. Onscreen tool tips offer additional information (right-click, left-click, double-click, etc).

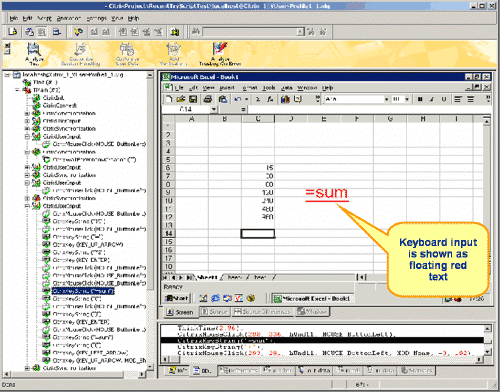
Value strings (keyboard input) are visualized onscreen as floating red text until target window captions are identified (in subsequent nodes) to indicate where strings are to be input.
