Health Dimensions
Each of these health dimensions and the overall health rate itself are represented by values in the range of 0-100 (the higher the value, the better the health of the system).
Health values aren't always expressed as percentages (10%, 20%, 30%, etc); only availability and accuracy values are expressed as percentages. Performance and overall health values are expressed as absolute rates (10, 20, 30, etc.).
Health dimension values are calculated after each monitoring transaction. For individual transaction runs, both availability and accuracy are calculated to be either 0% or 100% (intermediate values aren't applicable for these health dimensions).
- Accuracy is calculated only when a monitored system is available (Availability = 100%).
- Performance is calculated only when a monitored system is available and accurate (Availability = 100%, Accuracy = 100%).
If these standards aren't met and performance values are based on a faulty system, when other values are compared to the optimum performance of the system, misleading results will be returned.
When you review the health dimension values offered by Performance Manager, you normally review values that have been calculated based on multiple monitoring transactions. So, when evaluating health dimension values, keep in mind that the health dimension value for a set of monitoring transactions is equal to the average value of all of the corresponding and existing health dimension values of all individual monitoring transactions.
Availability
Availability is the most basic health dimension. It measures the percentage of time during which a monitored system is available to a subset of selected data. The availability rate provides information regarding whether a monitored system is running and whether it provides basic responsiveness to client requests.
A system is judged available when a monitoring transaction testing a system completes without detecting an error. Most errors indicate that a system is not available. Exceptions include those errors that indicate that a system is available, but not working correctly.
If several monitors are supervising a system and some of those monitors detect that the system is not available while other monitors detect that the system is available, the availability of the system will be rated near the middle of the 0% - 100% scale.
- BDL transaction messages that use SEVERITY_ERROR. Though not all transaction error messages cause Performance Manager to set Availability to 0. There are some types of messages that influence Accuracy.
- Custom counters created with BDL functions MeasureInc() and MeasureIncFloat(). When a transaction creates a custom counter with a name that begins with the prefix AV_, Performance Manager sets Availability to 0. A custom counter with the name AV_Server application not running, for example, would result in an Availability rating of 0. The Server application not running Availability message would appear in the Performance Manager GUI.
Accuracy
The accuracy rating for monitored systems is calculated only after systems are determined to be available.
Accuracy rates reflect whether monitored systems work as designed and if information transmitted to clients is correct. Useful functions that can be evaluated to determine accuracy include link checking, content validation, title validation, and response data verification. If a monitoring script contains customized functions that are used to ascertain system accuracy, these functions will also be factored into the accuracy rate.
Accuracy ratings go far beyond simply checking for availability. A server may be available even when the application it hosts isn't responding. Likewise, dynamic pages may be corrupt, database queries may produce empty result sets, and warehouses may run short of stocked merchandise. The simple checking of availability will not alert one to such failures. Only complex transactions that compare results to benchmarks detect such problems.
- The following BDL transaction error messages are associated with Accuracy:
- HTTP errors that are not of the 5xx kind (for example, HTTP 502 - error response received from gateway is associated with Availability)
- Errors resulting from verification functions
- Custom errors created using the RepMessage() BDL function
- Custom counters created using the MeasureInc() and MeasureIncFloat() BDL functions. When a transaction creates a custom counter with a name that begins with the prefix AC_, Performance Manager sets Accuracy to 0. For example, a custom counter called AC_Incorrect sort order would result in an Accuracy rating of 0. An Incorrect sort order Accuracy message would then appear in the Performance Manager GUI.
Performance
Once a monitored system is judged to be accurate, the performance health dimension of the system is calculated. Performance rates are based on sets of timers and counters that are created via BDL transaction system-monitoring.
First, each measurement that influences performance (for example, page-load time for a "Welcome to the shop" home page) is transposed into a performance value in a process called normalization. Secondly, the average of the performance values is used to define the performance rate for the corresponding transaction run.
- Transaction Response Time
- Average Page Time of Web pages - When a transaction creates timers for individual pages, the Average Page Time is ignored when calculating Performance.
- Page load times for individual Web pages
- Custom timers whose names begin with the prefix SV_
- Custom counters whose names begin with the prefix PE_
These measures can also be configured in the GUI and in the Boundary Editor. See Configuring Silk Performance Manager for details.
Example
Assume, we have a transaction called CheckMyServer. In the GUI we define the performance setting as follows:
- Transaction Response Time: display only
- Page Timers: performance rating
- Custom Measurements: performance rating
The transaction CheckMyServer calculates the following measures:
- Transaction Response Time: 8.2 secs.
- Average Page Time: 16.5 secs.
- Page Time for the Login Web page: 3.8 secs.
- Custom counter PE_Handles: 296
• Custom timer InitTransaction: 0.82 secs.
First Performance Manager calculates Performance values for some of these measures, as described below (the values specified here are for demonstration purposes only):
- Transaction Response Time is set to "display only" in this example and is therefore ignored.
- Average Page Time is also ignored because there is a page time available for the "Login" page.
- Login Web page: Performance 92
- Counter PE_Handles: Performance 32
- Timer InitTransaction is ignored because it doesn't begin with the prefix SV_
Secondly, the average of the calculated Performance values is used to define the Performance rate for this run of the transaction. This results in a Performance rate of 62 for the run.
Normalization
- With the assistance of an expert who is familiar with the capabilities of a system, good and bad measurement values can be identified.
- If no such expertise is available, values can be compared to previous measurements to determine if they are relatively good or relatively bad compared to past performance.
There is no difference between calculating performance rates for timers and calculating performance rates for counters. Both are treated the same, thereby enabling health rate comparisons.
Normalization using boundaries
In the first scenario (having an expert specify good and bad measurement values) static boundaries, defined using the Boundary Editor, are used to define comparison values. Therefore, there are two values, b1 and b2.
Boundary b1 may be considered the better value (i.e., the "warning level"). b2 represents a more critical value (i.e., the "error level"). So if lower values are better than higher values, one must define b1 as being lower than b2. If higher values are better, one must define b2 as being lower than b1.
If the two boundaries are equal (or if they aren't set), there is no way to tell if higher or lower values are better. Performance Manager can't normalize such user-bound measurements and therefore such values do not influence performance rate.
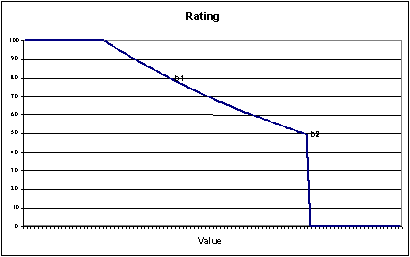
When an expert provides two values for comparison, the performance rates that correspond to the values must be specified. This is defined using the Performance Manager SVAppServerHomeConf.xml configuration file and is the same for all measures in all projects. Default values specify that a measured value equal to b1 results in a performance rate of 80, while b2 corresponds to a performance rate of 50.
Other values are evaluated as follows: if a value is beyond b2, the performance rate is determined to be 0. The reason for this is that Performance Manager considers b2 to be the threshold of unacceptable values. All values beyond this threshold are treated as performance failures of the monitored application.
Between b1 and b2 values are interpolated exponentially. This also applies to values beyond b1, unless the interpolated value is higher than 100. In such cases the performance rate is determined to be 100.
The following chart illustrates user-bound normalization.

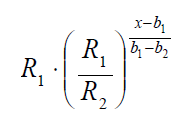
The formula that is used to interpolate the rating curve is an exponential curve through the two points (b1, R1) and (b2, R2):

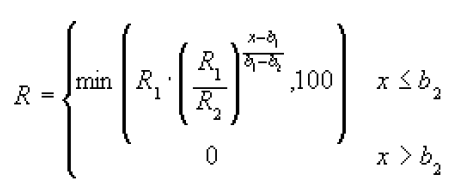
The entire formula is:

Where b1 and b1 are the boundaries, R1 and R2 are the corresponding performance rates, and x is the measured value.
Normalization based on past measurements (automatic bounds)
If the boundaries in a script are not defined, or if values are not useful for monitoring, Performance Manager can calculate performance rates by comparing measured values with previously recorded measurements. This approach offers relative judgments on the state of a system, rather than absolute judgments. When systems perform within their normal range, there is no need to raise warnings. If normal performance is bad, monitoring won't help much and systems must be redesigned or re-scaled. Therefore Performance Manager looks for exceptional values-exceptionally high values in most cases. If a custom timer or a custom counter is used, the boundaries defined in the script are used to define if a high value is good or bad. Apart from that however, values are ignored. When the boundaries of a custom timer or counter happen to be equal (for example, both are set to 0), the lower value is considered to be better.
In order to judge if measured data can be considered normal or out of the ordinary, Performance Manager uses the average and the standard deviation of historical value. A value has to lie far away from the average values, where far away means much more that the standard deviation. The idea therefore is, to use a band around the average, where the width of the band is derived from the standard deviation. That band defined which values are considered to be normal. For example for a rather stable system the measured values will lie closely together. The standard deviation will be small and the band within the future values are expected to lie will be narrow. A small deviation from the average will already suffice to raise suspicion as this is not common in this scenario. Another example could be a Web site where the page time vary depending on other network traffic and other influences. Here the standard deviation would be rather high and only exceptionally high response times, like time outs, would lie outside of this band. Thus, false alarms caused by normal variation of the throughput would be eliminated.
So in this approach, the boundaries b1 and b2 are calculated using the average (µ) and standard deviation (s) of previously measured data. In general, the average and standard deviation is calculated using all historical data beginning with the creation of the monitor. This results in rather stable boundaries after an initial calibration period. The length of this period depends of the schedule interval and the distribution of the measured data. Generally, after about 100 measure points, that is after a day using a 15 minutes schedule, the boundaries should be calibrated.
By default, all data since the monitor was created is used for calculating the dynamic boundaries. Sometimes, the normal behavior may change, because of hardware changes like new servers of a better network connection, or because of software updates with a better overall performance. In these cases it would take a rather long time for the boundaries to readjust. Therefore it is possible to reset the dynamic boundaries and restart the calibration process beginning with the current date. See Configuring Static Boundaries for Performance Values for a description of this feature in the Web GUI.
Historical data defines the dynamic boundaries b1 and b2 with this approach, however the corresponding performance rates of R1 and R2 are still defined in the configuration file.
To calculate dynamic boundaries, the average (µ) and standard deviation (s) of previously measured data are used, along with two factors that are defined in configuration files along with performance rates, R1 and R2. By default, these two factors are f1 = 1 and f2 = 6.
Therefore, b1 = µ + f1 · s and b2 = µ + f2 · s.
In the case of custom timers and counters, if the boundaries defined in a script indicate that higher values are better than lower values, then b1 = µ - f1 · s and b2 = µ - f2 · s.
This formula has a slight disadvantage if there are only a few values available. If the first data points lie closely together the standard deviation is small and the average may still vary. In order to compensate this, a factor is introduced to widen the band of allowed values by pushing b1 and b2 further away from the average.
The final formula is bi = µ ± fi · (s + 2|µ|/(N+1)), where N is the number of data points used to calculate the average and the standard deviation. The term 2|µ|/(N+1) gets smaller with every new value until it does not influence the boundaries any longer.