The ESMAC interface is displayed using a browser. You can, therefore, monitor and control
Enterprise Server instances across the Internet, or your intranet, from a browser.
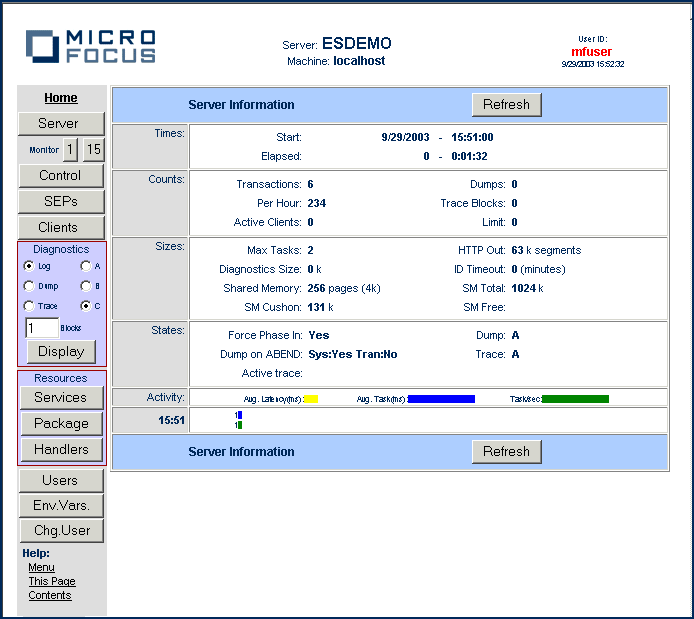
When you first view ESMAC, the Server Information page is displayed, as shown below:
Figure 1. ESMAC Server information page

ESMAC enables you to:
- Obtain information about the server you are currently connected to.
- Monitor services occurring on the server.
- View and change various parameters associated with server, such as the number of service execution processes, the active diagnostic datasets, and any trace control flags set.
- View information about service execution processes (SEPs), stop SEPs and obtain trace information for them.
- View information about client processes running on the server.
- View console logs, and dump and trace information.
- View information about the services, packages and request handlers defined on the server.
- Add, delete and change the permissions of users who can administer servers.
- View the environment variables associated with the server.
- Login as an administrator.
The ESMAC interface is split into two areas:
- A menu, in a sidebar on the left side of the page, which provides buttons with which you can control ESMAC.
- The main body of the page, which displays the monitor and control information. The information and controls available here depend on the button you click in the menu.


