3.9 How to access the node dashboard?
-
Select a cluster, then select Dashboard.
-
The Nodes tab displays all nodes for the selected cluster.
-
Select a node, then select Dashboard.

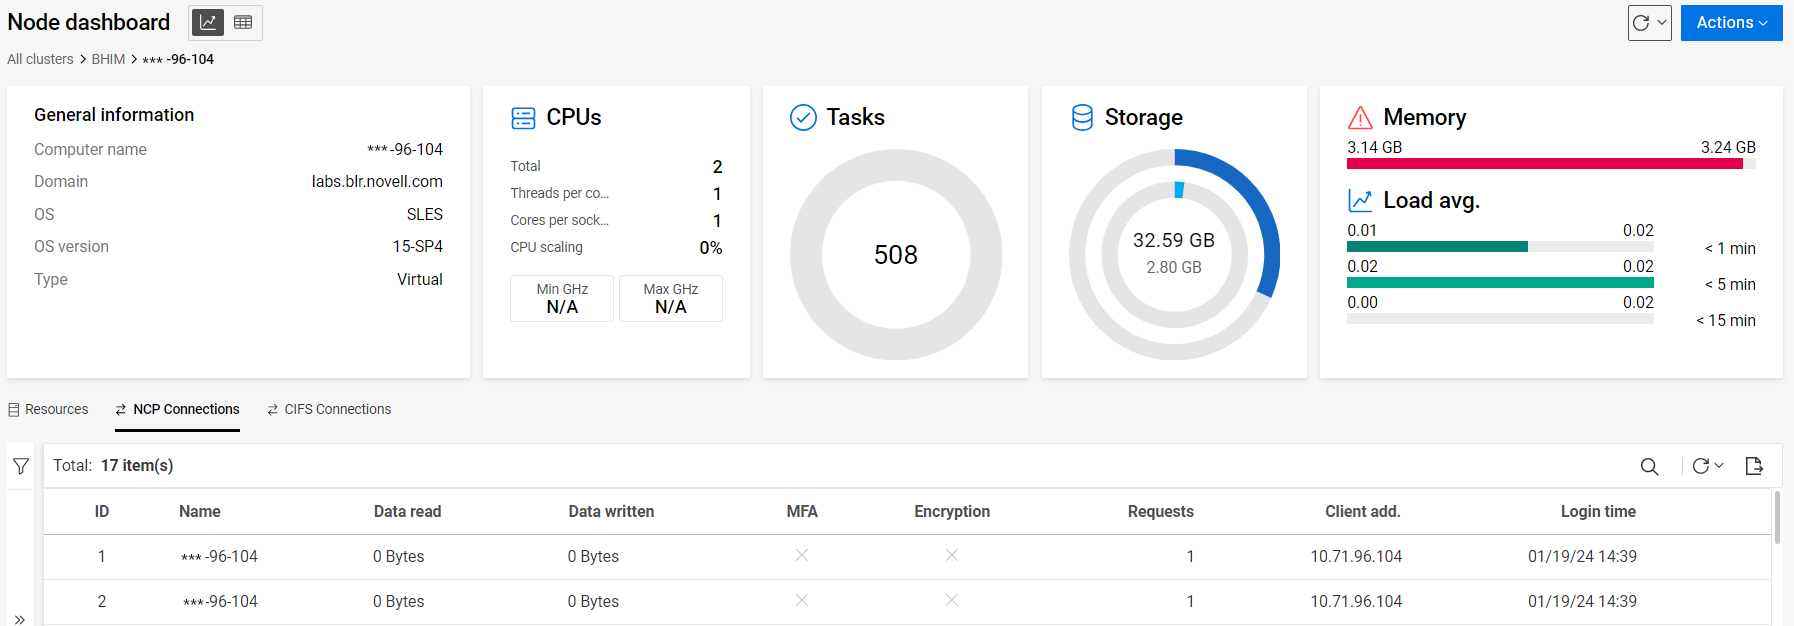
The node dashboard displays server statistics such as general information, CPU utilization, tasks, storage, and memory details.
The Actions menu provides options to shut down or restart the selected node.
NOTE:For a virtual machine, the minimum and maximum values of the CPU are displayed as N/A.