Connection Charts
Connection charts display data pertinent to the selected connection. On the dashboard, select a conenction, and click the Charts tab. To refresh the charts, click the connection.
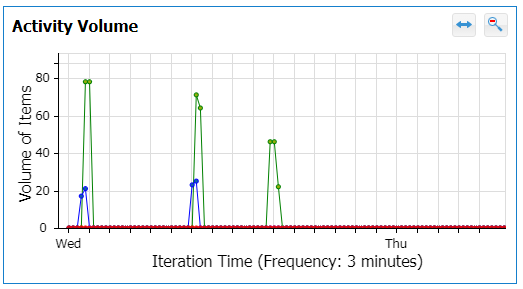
Activity Volume
Displays the activity of the selected connection.

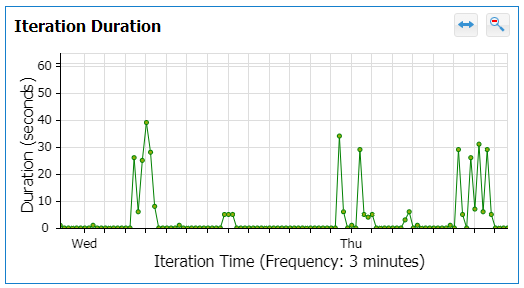
Iteration Duration
Displays how long (in seconds) each iteration takes.

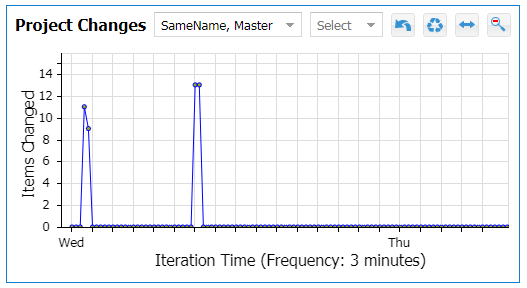
Project Changes
Displays the changes for the selected project and type. If a type is not selected, then it displays changes for all types.
