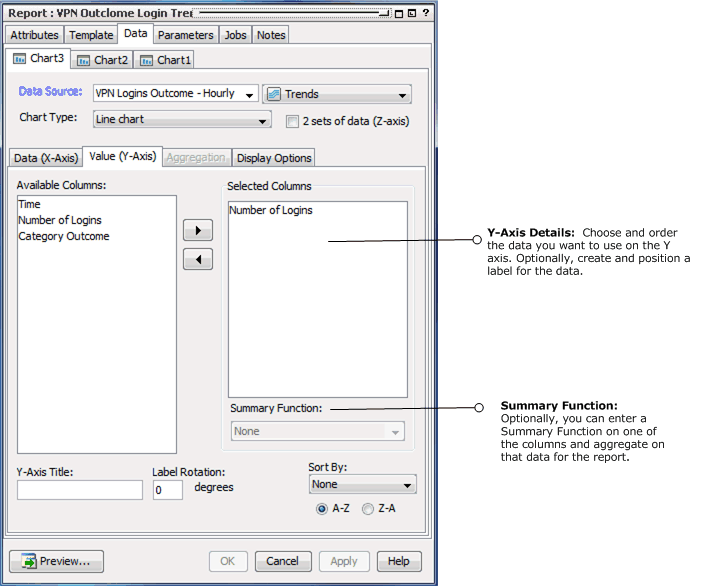
Selecting Data for the Y-Axis on a Chart

Y-axis data should be numeric. If the data you select is a non-numeric data type, such as a string, apply a numeric summary function to it, such as Count or Count distinct.
|
Y-Axis Data Attribute |
Description |
|---|---|
|
Available Columns |
Select the data fields from the query you want to show in the Y-axis and use the right-hand arrow to move it to the Selected Columns area. The data you select here should be the item you want to count by. For example, to show how many addresses each of your attacker zones have, you would select the attacker address. |
|
Selected Columns |
The Selected Columns area shows which data fields you have selected for the Y-axis, and provides the opportunity to change the sort order of the data. |
|
Summary Function |
You can assign a summary function to one or more columns of data. (In the “Function” row for a column, click in the column to get a drop-down menu of functions.)
Selecting one of these functions activates the Aggregation tab, where you can set further parameters on these functions. To set a function, select a column, and choose a function from the Summary Function drop-down menu. |
|
Y-Axis Title |
Type in a title for the Y-axis. |
|
Label Rotation |
Select a rotation angle for the by entering a digit between 0 and 90. Labels refer to the individual Y-axis data points, which are automatically derived from the data. The Label Rotation controls the angle of these labels. |
|
Sort by |
Optionally, choose a sorting order for the data on the Y axis. You can display data alphabetically (the default), reverse alphabetical, or sort by count. Caution: If you are plotting a Z-axis (data series) and your output is a bar chart, make sure to set your sorting on the X-axis. |