Specifying Top/Bottom Filters Aggregation Filters for a Chart (Optional)
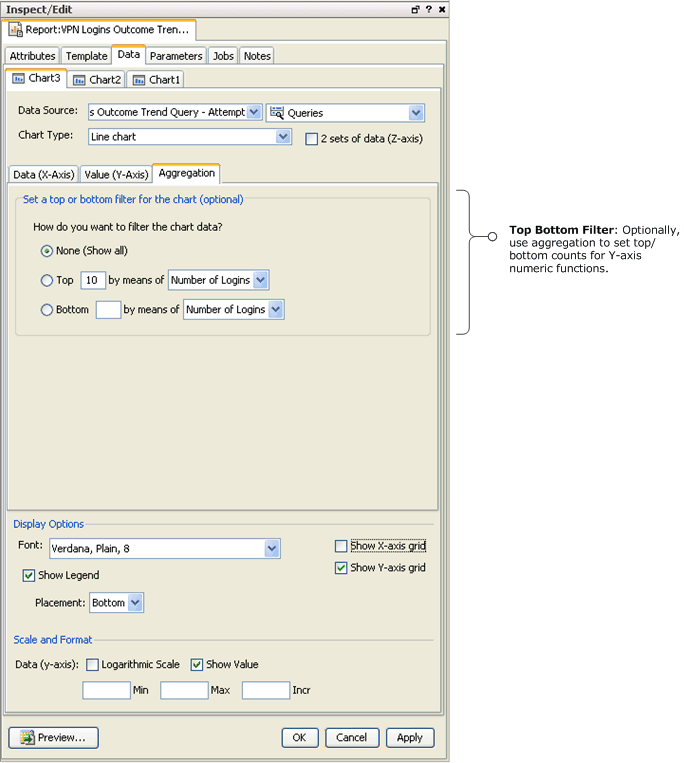
You can also set Top/Bottom Counts for a chart. This tab only becomes active when a summary function is applied to data in the Y axis. Settings in the Aggregation tab set top/bottom counts to data with summary functions applied. This is an optional step.

On the Chart Aggregation tab, set the top or bottom filter for the chart. If there are more charts in your report, repeat these processes until data is bound to all the charts and laid out in your report template.
|
Aggregation Top/Bottom Filter |
Description |
|---|---|
|
None (Show all) |
By default, no top/bottom filter is set. |
|
Top |
Select Top if you want to show the a certain number of entries with the highest values. Enter a digit in the text box, and from the drop-down list, select an appropriate |
|
Bottom |
Select Bottom if you want to show a certain number of entries with the lowest values. Enter a digit in the text box, and from the drop-down list, select an appropriate Y-axis data column with a function applied. |