Query Viewers
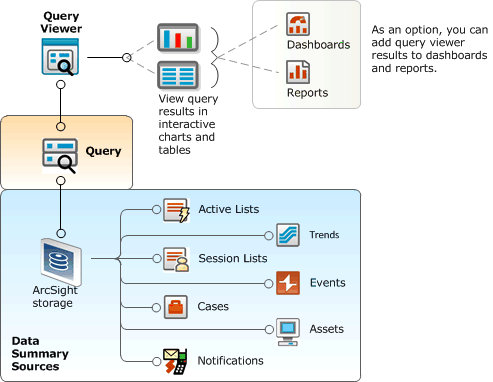
Query Viewers are a type of resource for defining and running SQL queries on other resources, including trends, assets, cases, connectors, events, and so forth. Each query viewer contains an SQL query along with other logic for establishing and comparing baseline results, analyzing historical data to find patterns in network activity, and performing drill-down investigation on a particular aspect of the results.
You can use query viewers to run the same queries used for reports, and get results quickly. Then, if desired, you can generate a simple report directly from the query viewer results. Full-featured reporting (with queries, trends, and templates) is still offered for more robust reporting requirements (see Building Reports), but query viewers provide a shortcut to running those same SQL queries apart from reporting.
Query viewers provide high-level summaries to monitor system health, reveal trends, and allow for drill-down investigation of all types of resources. Query viewers can work with trend tables rather than event tables, and so can return results much faster than Active Channels.
See Query Viewers for information about using and building query viewers.
Also, you can generate simple reports directly from query viewer results.

Query viewers provide:
-
A quick way to run SQL queries and trends apart from full-scale reporting. If you want to run a pre-built SQL query and view results quickly, or build and test several iterations of a custom query, query viewers are an easy way to do it. (You can also generate a simple report directly from a query viewer.)
-
High-level summaries. For example, using the aggregation provided by queries and trends allows summaries of “interesting things” over the last month, day, or hour.
-
Non-event-based summaries. Queries can be used to analyze resources other than events (such as assets and cases).
-
Event-based summaries. Queries can be used to analyze events, and eventually lead to active channels (with drill-down investigation).
-
Baselines. Analysts can apply a baseline to the information resulting from a particular run of a query viewer. A baseline acts as a reference point against which to compare results of other runs of the same query and highlights the deltas (differences) to help identify areas that vary significantly from normal.
-
Drilldown. Query viewers can provide drilldown investigation into the same or another query viewer for good performance on the next level of results as well. Ultimately, the drilldown can lead to an event channel, where the performance costs are the trade-off for the power of event-based analysis in an active channel. The query viewer author defines the appropriate drilldown paths and levels.
-
Performance. Query viewers can use trend tables which are typically much smaller than event tables, and can be pre-built with summary views in mind. So, in most cases query viewers can return and display results faster than Active Channels.
-
History. When based on trends, query viewer result data can be kept for as long as desired and be independent of the event archival process.
-
Flexibility.ArcSight provides both pre-built query viewers and a resource editor for adding custom query viewers to suit the needs and environment of your organization.
-
Presentation Options. Query viewer results can be displayed as tables (with baselines, if desired), pie charts, and bar charts, and added to Dashboards for quick display and monitoring.