Binding Data to Tables
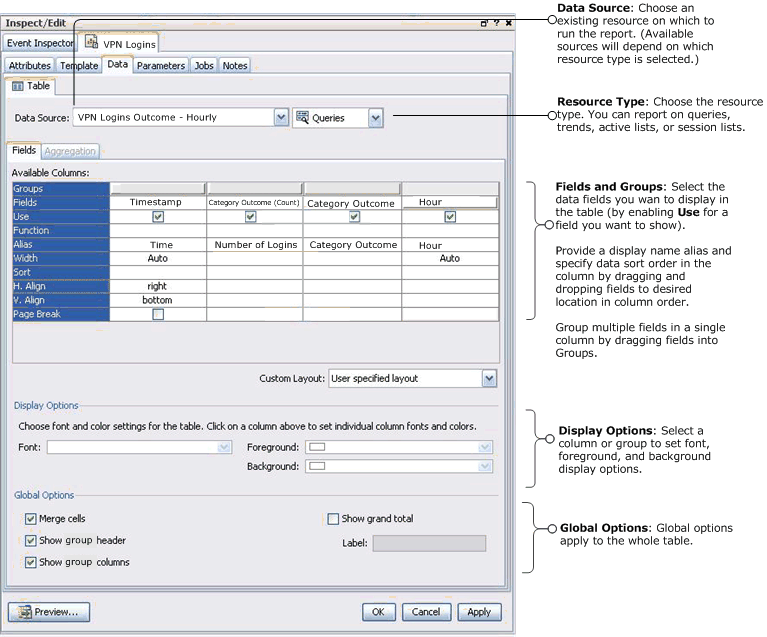
If the template you selected contains a table, use the Table Fields tab to build a visual representation of a table in which to display the query result. You can choose the type of data source (trend, query, active list, or session list) and the particular data source (which query, trend, and so forth) to report on. Then you can select which fields from the data result to appear in your report (with the “Use” check box). Use Groups to combine fields into a single column in your Report table (drag and drop or menu commands available for the report table).
|
Table Data |
Description |
|---|---|
|
Data Source |
From the drop-down menu, select an existing data source you want to use for the table part of your report. The data source drop-down menu provides a list of existing resources based on the resource type you selected in the accompanying drop-down. You can report on queries, trends, active lists, or session lists. When the data source is selected, the remaining elements of the Data tab are populated with the data from the selected resource. |

Related topics: