Adding a Drilldown
You can configure query viewers and data monitors to drill down to one or a combination of the following resources:
-
Active channels
-
Dashboards
-
Query viewers
-
Reports
Each drilldown type has its own options. After you have added one or more drilldowns, Console users can select one by right-clicking on the result and selecting Drilldown > [drilldown name] from the context menu.
Note: In a Custom View Dashboard and on the ArcSight Command Center, only drilldowns to dashboards are supported.
You can create drilldowns from these types of data monitors:
-
Event graph
-
Hierarchy map
-
Last N Events
-
Last State
-
Moving Average
-
Statistics
-
Top Value Counts
You cannot drill down to resources from the following data monitors:
-
Asset Category Count
-
Event Correlation
-
Geographic Event Graph
-
Hourly Counts
-
Rules Partial Match
-
System Monitor
-
System Monitor Attribute
Where: Navigator > Resources > Dashboards > Data Monitors tab > data monitor > Drilldowns tab
To add a drilldown from the data monitor:
-
Access the Drilldowns tab in one of two ways:
-
Right-click on the query viewer or data monitor results in a dashboard and select Drilldowns/Edit Drilldowns to open the editor to the Drilldowns tab.
Or
-
Right-click on a query viewer or data monitor in the Navigator panel and select the Edit option, then select the Drilldowns tab.
-
Click Add (
 ) to open the Add Drilldown panel.
 -
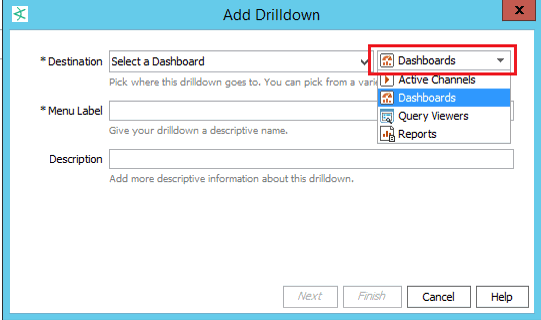
In the Destination field, select a resource type, for example, Dashboards.

Then choose the corresponding specific resource, for example, My_Dashboard.
-
Enter a menu label (defaults to the specific resource’s name). This label will represent this drilldown when the user right-clicks and selects Drilldowns on the Viewer panel.
-
Enter an optional description containing useful information about the drilldown.
-
 Set the remaining options based on your destination resource:
Options for the Drilldown's Resource Destinations
If resource type is ...
Follow these steps ...
Active Channels
For an active channel destination, the settings in the Channel Display Options tab are not required; you may click Finish. If you want to set display options:
-
Select a field set from the drop-down list and click OK.
-
Change the Sort By field from the drop-down list and the sort order.
-
Click Finish.
Dashboards
Click Finish. You are done.
Query Viewers
For a query viewer destination, field mapping is required:
-
On the Field Mapping tab, click Add to display a dropdown list of source fields. You must define at least one field map.
The source fields are from the source query viewer (the one you are drilling down from). The mapping condition is always set to =.
-
Under the Destination Field column, select a field from the destination query viewer (the one you are drilling down to).
The Drilldown definition shown in the example maps the source query viewer/data monitor “Name” column to the target query viewer/data monitor “Name” column. This constructs the following drilldown filter:
<
target>.Name = <source>.Namewhere <
source>.Name is replaced by the actual value from the source query viewer/data monitor row.If there are no eligible field mappings, you cannot complete the drilldown definition; the Finish button is disabled. You can add or remove field mappings, but your choices are limited to the columns already provided in the query viewer.
-
On the Display tab, you can choose to show (check) or hide (uncheck) the data fields in the drilldown result.
-
On the Sort tab, you can click Add to select the columns to specify the sort order of the resulting values. For each added column, change the sort order to ascending (the default) or descending.
-
Click Finish.
Reports
For a report destination, the settings in the Report Display Options tab are not required. To use the parameters set for the report, click Finish. If you want to change the drilldown’s display options:
-
Click Add to display a list of the destination report’s custom parameters, then select a parameter.
-
Under the Value column, select the field whose value will be used for the parameter.
-
Click Finish.
-
-
Repeat the process to add multiple drilldowns as required.
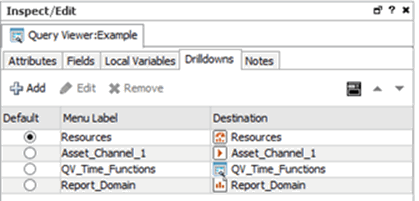
The drilldowns you added will be available for selection when you view the data monitor or query viewer results. From those resources, the drilldowns are displayed for selection in the order they were created. The first drilldown is automatically the default drilldown of choice.
Tips on drilldown definitions:
-
If there is only one drilldown, this is the default drilldown for that resource. If there are multiple drilldowns, the first drilldown is the default. You can change the order on the Drilldowns tab.
-
When you run the query viewer results or view a data monitor, right-click, and select Drilldown, the selection list displays the list of drilldowns defined for that resource. The default drilldown is at the top of the list, and the remaining drilldowns are displayed in the sequence as they appear on the data monitor or query viewer's Drilldowns tab.
-
You can define drilldowns for multiple fields of different data types. For example, you can define a drilldown to return a combination of event name and IP address. The first step would be to define a base query viewer to return these fields in a result, and then, as a next step, add a drilldown and select that query viewer to use as the “Drill down to” query viewer.
-
You cannot define drilldowns to go to fields that are SQL functions.
Example of drilldowns added to a query viewer
